
|
British / Dutch Comparison Photos Policy Articles Infrastructure photos Also see:Our cycle campaigning blog: Dutch bicycle parts and accessories:  |
(Mainly) Dutch Cycle Promotion articlesIf often seems that the English speaking world does not understand how the Dutch have been so successful with their cycle promotion. Why is it that the small population of the Netherlands (16 million) makes more cycle journeys than all English speaking countries put together ? Why is the Dutch cycling rate so far ahead of the rest of the world, and why is it still growing ? Is Holland somehow special ? Are the Dutch special ? It is also quite often assumed that Dutch drivers must be far better behaved than those in the UK and other countries in order that cyclists can have such a good degree of safety. Or the reason is put down to the country being relatively flat. There are many myths. The country's flatness doesn't necessarily help. It results in very strong headwinds bringing changeable weather. Also, the Netherlands can be very cold in the winter. However, the convenience of cycling wins out over these problems. It is actually very simple. Generally when you cycle in the Netherlands you are not sharing space with cars. This makes cycling very pleasant and relaxed. It reduces conflict with motorists and it leads to much greater safety. What isn't necesarily so obvious to outside observers from locations with less advanced cycling infrastructure is that it also leads to cyclists having journeys which are more direct than those of motorists. As a result, cycling is a much more appealing form of transport. On this web page we also provide pointers to information about Dutch cycling provision from the people who implement it. Most of the articles produced by the Dutch are in the Dutch language. However, I have collected together here some English language documents. 
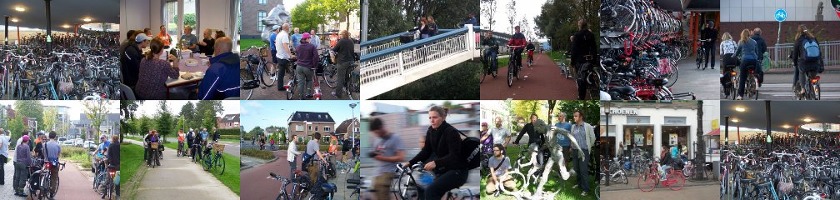
We organise Study Tours which show the excellent provision for cyclists in the Netherlands to interested parties, be they campaigners, council officers, planners, engineers, journalists or just interested cyclists. Please see our web page for more details. CROWThe CROW Design Manual for Bicycle Traffic is a very good reference to Dutch cycling infrastructure. Note, however, that it is not a complete guide and it has an unstated context which won't be familiar to many readers. The manual is written from the point of view of a Dutch person who probably cycles daily and knows what happens in reality. A very passive voice is used and therefore it doesn't say much about why one solution might be preferred in reality over another. Some examples are of things which would currently be built, some are not. Note also that Dutch planners often take CROW statements about such things as widths of cycle-paths as minimums and not as maximums. i.e. what is implemented is better than the guidelines would suggest. For these reasons we feel that while CROW have done a very good job, the result can mislead English speaking professionals almost as much as it helps them. Fietsberaad articlesThese articles are all from the Fietsberaad. The Fietsberaad is a government organisation made up of experts in design with representatives from cities and organisations around the Netherlands. Cycling Policies of Ten cycle friendly cities. Includes a plot of cycle usage over time for cities with a lot of cycling and cities with less cycling. Shows that cycle usage in cities with low cycle usage now was historically much higher. Photos of mass cycle use before the second World War Two and in modern times. This shows clearly how the Dutch taking action in the early 1970s reversed the decline which continued in other countries. Cycling in the Netherlands. Includes many statistics about modal split in the Netherlands and other countries, injury rates, bicycle ownership, theft rate, funding etc. It also includes some really lovely photos. (older version here). Nationally, 27% of all journeys made for all purposes are by bike. Interesting point: 70% of all journeys in the Netherlands are under 7.5 km, while 11% are between 7.5 km and 15 km and 18% are over 15 km. That's very much the same as transport patterns in any country. However, 34% of those short journeys, 15% of the intermediate journeys and 2% of the longer journeys are made by bike. 2% is a figure higher than many countries manage for their shorter journeys. The Dutch Bicycle Master Plan 1999 - covers history from the 1890s and policy up to 1999. Includes such gems as that the first guarded cycle storage was opened in 1895, the first cycle paths around the same time. Goes over the decline of cycling followed by its return, and recent Dutch policies on building cycle paths which have increased cycling and decreased the rate of accidents. Also note how Dutch cities were removing cycle facilities as late as the 1960s. "In 1963, Heerlen decided to remove a number of bicycle paths along several main roads and to use that space for widening the streets and car parking facilities". Facts about cycling in the Netherlands 2001 - referring to Dutch Bicycle Master Plan of 1999. This document contains a lot of detailed statistics about how many trips are made by different modes of transport, by different ages etc. There are also databanks of ideas which though they are in Dutch may provide some inspiration: Example bank - this features photos of different types of cycle infrastructure (select Crosspoints, Road craft, Cycle Parking from the menu on the left). Fietsersbond articlesThese articles are from Fietsersbond - the national cyclists union of the Netherlands. This is the national group which campaigns for better conditions for cyclists. This often means campaigning for more segregated cycle-paths. Fietsparkeur - a system of approval for cycle parking. Bicycle Parking at Dutch Railway Stations. Tips for locking bicycles and spotting stolen bicycles - The Dutch have quite a big cycle theft problem. Dutch Language Documents from Assen which may be of interestI've collected here some Dutch language documents which are not too difficult to understand for the English speaking reader. These all relate to Assen.  Fietsplan Kloosterveen - Kloosterveen is a new housing development in Assen. This is the cycling plan, showing the standard of provision that new developments are required to have in the Netherlands. From the start, this new suburb was planned to have 86 cycle trips per day per 100 residents. In addition, it was expected that primary school children would make 2/3rds of their trips to and from school by bike. A high modal share for cycling doesn't come by accident but through planning. Expenditure on cycling in Assen in 2005/2006 - nearly €6M. The population is 65000, so that works out as a little over €90 per person. Capital expenditure on new infrastructure is around €1.8M per year, which works out as about €27 per person per year. New developments provide their own infrastructure on top of this and maintenance comes from a different budget. Cycle Transport Notes - September 2005 document about cycling in Assen. What needs to happen over the next 5 years. Action programme for 2007-2010 - works to be done on cycle paths. De fiets in de regio report on cycling in the Groningen-Assen region. Danish documentsThe Danes also produce some good cycling literature in English. While it still has a lower modal share than most Dutch cities, and in fact a lower modal share than the Netherlands as a whole, Copenhagen is ahead of all non-Dutch cities in Europe. Copenhagen Cycle Policy from 2002. Copenhagen has around a third of commutes by bike and about 20% of journeys overall. Various targets are set in this document. Copenhagen Bicycle Account 2002. The cycling to work rate decreased to 32% since the last measurements. Copenhagen Bicycle Account 2008. By 2008, Copenhagen had grown the commuting rate to 37%. Copenhagen no longer reports their "all journeys" rate, which is probably now around 22% of journeys. A 2009 press release from Copenhagen City. Sadly, most targets from 2002 have not yet been met. In particular, the commuting rate is still only "more than a third", no mention is made of the overall figure, which is probably still around 22%. Despite much being written about Copenhagen, that is still a long way behind the 57% modal share of Groningen and even the 27% modal share for the entire Netherlands. NorwayUKSteve Melia's piece in Local Transport Today about permeability in new developments (other articles from the same author). Eco-logica.co.uk report on 6 European cities. Sustainable Future for cycling a document from the department of transport which contains figures for the low amounts spent in the UK, and the limited results they have had. This focuses on showing impressive looking figures, such as 172000 extra cycle journeys being made per year by 10000 households in Brighton. However, given an average of 3 people per household, that actually amounts to only around 5 journeys per year per person. It is similar on money spent. Divide their figures by the number of people the money is being spent on. Segregated Facilities. Paul Gannon. This counters one of the more ludicrous claims made by some people who oppose cycle-paths. i.e. that Dutch cyclists have somehow been made less skillful by the existance of a good quality network of segregated paths. USAHow cycling was made "Irresistable" in the Netherlands, Denmark & Germany John Pucher and Ralph Buehler, Bloustein School of Planning and Public Policy, Rutgers University. Cycling safety on bikeways vs. roads. John Pucher vs. "Vehicular Cycling". AustraliaCycling 'keeps Danes, Dutch thin' Article from "The Australian" about health benefits of mass cycling. European Network for Cycling ExpertiseEuropean Environment AgencyAre we moving in the right direction ? Indicators on transport and environmental integration in the EU: TERM 2000. Gives figures for number of families without a car. 42% in the Netherlands vs. 30% in the UK despite car affordability being higher in the Netherlands (these figures are on page 63). This is directly due to the Dutch finding cycling an easier way to make journeys than the British. PhotosWe have a separate web page with photos of Dutch cycling facilities. You will also find very many photos on our blog. If you wish to make commercial usage of our photos, please contact us. See also our review of the book "Assen Verandert" ("Assen Changes"). This excellent book shows views of improvements that have been made to this city in the last forty years. Our blogWe have a blog which is largely about individual aspects of cycling in the Netherlands. This includes videos and photos which explain how various aspects of the infrastructure work. About UsJudy and David Hembrow are experienced English cyclists who moved to the Netherlands in 2007. In addition to the Cycling Study Tours we also organise Cycling Holidays based in Assen. 
|